Argentina School Choice: Buenos Aires
Summary
- Type: Centralized
- Algorithm: Immediate Acceptance
- Quotas: No
- Priorities:
- Already in institution
- Relative working in the institution
- Sibling
- Walking distance
- Tie-Breaking: Single lottery
- Maximum schools: 8
Introduction
With a population of over 3 million inhabitants and an area of 203 km$ ^ 2 $, Buenos Aires is one of the largest and most important cities in Latin America. And its public education system is also one of the largest in the region. About 65,000 students enter one of the more than 1,000 public institutions each year, including initial, primary, secondary and special schools. In total, around 250,000 students attend a public school each year, and another 250,000 attend a private institution.
In 2013, The Government of the City of Buenos Aires invested between 2 and 2.5 million dollars in the implementation of the new online registration system (called Sistema de Inscripción en Línea). Its main objective was “to provide the different areas of the Ministry with an integral solution that allows them to manage, streamline and automate management processes and tasks in schools and level areas, with a tool that allows them to have access to accurate information, necessary to generate management reports and facilitate analysis”. Additionally, this change “includes the development of an online registration system for applicants that enter the Schools, accompanying the process of ‘depaperization’ and the incorporation of technological innovations in the educational field” 1. In other words, the main objective was to increase efficiency and transparency by incorporating technology.
The new system
Students must now access the designated site, where they are asked to enter certain required documentation and report specific information. Among the required information are the student’s address, socioeconomic status, and other demographic variables. Additionally, they are required to indicate whether they have siblings attending the institution or relatives working at it. They are then presented with a list of 5 schools based on the information provided 2, and then they are offered the possibility to add up to 3 more schools, without restrictions among all the schools in the city. Lastly, the student must sort the (between 5 and 8) schools on his list according to his preference. This list, along with the documentation, is then submitted. An administrative officer conducts a check on the documentation presented at a later date. Curiously, this system makes Buenos Aires one of the few jurisdictions in the country to carry out this process completely online, and one of the very few to allow students to enroll in more than one school (Ministerio de Educación de la Nación, 2019), although several other jurisdictions have been forced to implement online systems
When the registration period ends and all registrations have been received, a centralized algorithm assigns students to schools using the previously mentioned priority system. The algorithm works as follows, as explained in the official regulations3.
The allocation of vacancies will be made according to the ordering of educational establishments that is reflected in the preregistration, and applying the prioritization rules established in this bylaw.
For this, the processing carried out by the online registration system will consider each of the division/grades/levels of each establishment as a “unit” for assigning seats, and within each one, and depending on the available places, the allocation of said seats will be made by taking all applicants who prioritized a certain unit (division/grade/level of an establishment, and shift if applicable) as the first option, considering for their ordering (within this universe of applicants) the application of the prioritization rules in accordance with the provisions of this bylaw.
Once all the applicants in this universe have been exhausted (that is, those who preselected that particular unit as the first option), and as long as there were seats available in that unit, the online registration system will continue to process this time the group of applicants who have preselected that particular division/grade/level of the institution as their second choice (as long as they had not obtained a seat at the institution they preselected as their first choice)
The Sistema de Inscripción en Línea will reiterate this procedural mechanic until the seats available in the division/grade/level of the specific institution are exhausted, or until the applicants who preselected that unit are exhausted.
For each unit (division/grade/level of a given establishment), in successive iterations, that is, in the gradual processing carried out on each universe of applicants who preselected the unit as an option in the same order (first option, second option, etc.), the Online Registration System will apply the prioritization rules to order applicants.
The priority rules differ slightly between the different levels, but consist mainly of having attended the previous level in the same institution, having siblings studying or relatives working in the institution, and living within a radius of 2,000 meters, in that order 4. Lastly, a single tie-breaking (Abdulkadiroğlu et al., 2009)5 lottery is carried out to break ties between students with the same priority standing. For students who weren’t assigned in the main round, seats are offered at schools that still have seats available through the same online inscription system.
It is easy to notice that the algorithm used falls within the Immediate Acceptance category. Therefore, the one main property that it lacks is strategy-proofness. Moreover, the administration is aware of the incentives created by the algorithm and warns families: “Bear in mind that the allocation of seats is based on priorities according to the allocation rules in the ‘Reglamento Escolar’, but also in the order in which you choose the schools. This means that if you select as the last option the school in which you have priority, and in the previous one you couldn’t be assigned a seat, it could happen that when you try to do it in this last school, it is filled with students who have chosen it as their first choice.”.6
Implementation of the new system
The transition to the new system was not without conflict. In its first year, before implementation, the Government faced opposition from unions, some parents’ organizations, and public institutions such as the Defensoría del Pueblo, which appealed to the courts claiming that the new system was not sufficiently transparent and that authorities had not given families enough time and information to prepare. Courts dismissed most of these legal accusations and allowed the modification to take place.
But the formal implementation of the system was also far from smooth. In its first year, a computer glitch caused hundreds of seats to be wrongly assigned, while assignments did not properly respect priorities. This led to a wave of complaints from the affected families, who demanded that the established priorities be respected. In response to these complaints, the administration decided to withdraw the wrongly assigned seats, leaving now other hundreds of students without a confirmed seat. This led to a second wave of complaints from families who had been assigned a seat and had now lost it. Meanwhile, hundreds of other families who had not been assigned a seat - some of whom probably did not notice that priorities had not been respected - wandered around schools trying to find a place for their children. In some cases, as reported in the report of the Defensoría del Pueblo (Defensoría del Pueblo, 2015), families decided to leave the public system and switch to private education due to the uncertainty caused.
Finally, most of these issues were resolved and the new system continued to function to this day, with minor changes. Although the level of conflict did not match that of the first year, some discussions persisted in the following years. The main problems in subsequent years were related to the lack of available places at the entry-level, leaving more than 11,000 entry-level students on waiting lists in 2016, explained in part by an increase in demand for kindergartens. The authorities tried to solve this lack of seats by building “Early Childhood Centers”, which operate in parallel to the public education system. Most of the children who do not get a seat in a school at the initial level are assigned to these centers. However, these centers do not fulfill the same function as the traditional school, so the debate on this issue continues.
Interestingly, in the first year of implementation, the new system incorporated an additional feature in the platform. During inscription, when families analyzed the educational offer to add schools to their list, the system showed for each school the “probability” of accessing a seat, this being “Low”, “Medium” or “High”. This, as reported in the system, was calculated based on the number of available seats and the number of students who had selected it as the first choice. If families selected a school that indicated a low probability, they received a message like the following: “Attention. The school you chose in first place has a low probability. Are you sure you want to continue? - Cancel - Confirm” (Defensoría del Pueblo, 2015) 7. But this system had a major flaw: it calculated probabilities in real-time, so families who enrolled in the early days of the enrollment period had a “High” probability across all schools, while those who enrolled later saw “Low” and “Medium” probabilities in most schools. This was also a cause of uncertainty among parents, as some interpreted that inscribing earlier in the registration period could affect their probability of getting a seat, even when this was not the case. In the following year this feature was removed.
Besides the previous situations, we can argue that the change served at least some of its purposes. The new system is decidedly simpler and more efficient than the previous one, both for families and for administrative staff. The new system also allows students to inscribe in a much larger number of schools, which theoretically should result in fewer students not being assigned to any school. It is also very likely that the systematization of the process has produced valuable information for educational policies. Perhaps not at first, but today there is no doubt that the new system is more transparent and that the priority rules are properly enforced conditional on the mechanism used.
Data analysis
Let us show some numbers about the new system. For this, we have public data provided by the Ministry of Education of the Government of the City of Buenos Aires, for the years 2015, 2016, and 2017. That is, we do not have data before the change, nor after 2017. The data consists of individual records for each student, including the school to which she was assigned, the grade and level to which she inscribed, in what period she enrolled, and in which place she had ordered the school that was finally assigned to her. This last variable is grouped into three categories: “1st place”, “2nd and 3rd place”, and “Other place”. Here, the category “Other place” includes students who were assigned to their option 4-8 and also those who were not assigned in the main round and had to choose between the options offered by the system, or were assigned administratively. The rest of the order of preferences is not available in the data, nor are demographic variables of the students. Due to the limitations of the data (mainly the lack of the complete preference list), we will only try to identify two potential problems: the high risk of not being assigned to any school if the student is not assigned her first choice; and the difference in outcomes between higher and lower-income families. This analysis will also be mostly descriptive as we do not have enough detail in the data to compare these outcomes under different algorithms. 8
Figure 1 shows the proportion of students who obtained their “first choice”, their “second or third choice”, and “other choice” (from 4 to 8 and unassigned), by educational level, for the three years available.
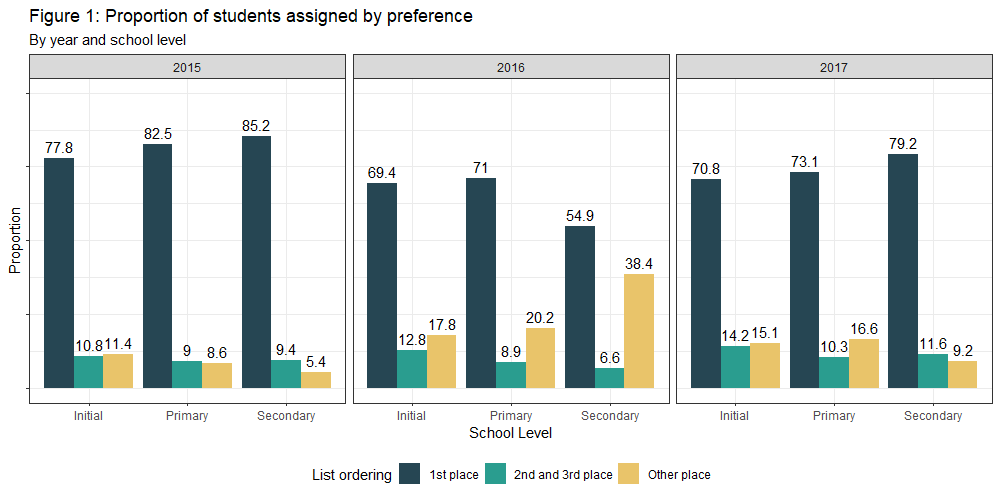
We can see that the proportion of students who obtain their first reported option is high and comparable to what was observed in the old Boston system (between 70\% and 80\%). This is not surprising given that the main goal of the system is to assign as many students as possible their first choice. However, as mentioned above, this can be misleading, as families have incentives to modify their preference list to maximize their chances of being assigned a seat at some school. In other words, the first option reported is often not the option that students would actually prefer in the first place. Moreover, this is recommended by the administration itself, so families are expected to show this behavior.
Additionally, in this figure we seem to observe a negative correlation between “1st place” and “Other place”. Note, for example, the case of the primary level. The proportion of students who obtained their first option in 2015 was 82.5 \% while for those who received another option it was 8.6 \%. In 2016, however, these numbers were 71 \% and 20.2 \%, respectively. That is, a drop of 11.5 percentage points was observed in the proportion of students who obtained their first option and an increase of 11.6 percentage points in those who obtained another option. Put another way, the proportion of students who got their second and third choices was not affected. Something similar happens when the rest of the levels are observed, or compared to 2017.
One way of interpreting this result under the theoretical framework presented is that students who for some reason are not assigned to their first option, do not receive their second or third, but that the vast majority remain without a seat (remember that those without seats are included in “Other choice” but we can’t separate them from those who got assigned to their choices four to eight). In other words, it is unlikely that the drop in students getting their first choice will almost completely transfer to options 4-8, without affecting options 2 and 3. In this sense, Abdulkadiroglu et al. (Abdulkadiroglu et al., 2006) shows, using Boston data, that preferences 4 and 5 added together represent less than 2 \% of total allocations. Although in that system five was the maximum number of schools that each student could indicate, it is reasonable to expect that the proportion of students obtaining each position in their order of preferences will decrease monotonically, so that the proportion of students obtaining options 4 to 8 should be very small. This would be consistent with one of the problems with this system – the high risk of not getting a seat if you are not accepted at the school reported as first choice. We can’t, however, know what this number would be under one of the other mechanisms with the data available.
It should be noted that behind the previous figure there is an important source of heterogeneity. We refer to the formal period in which the registration is made. Families can enroll in three periods: in the Ordinary Period, in the Complementary Period, or During School Year. Families are recommended to enroll in the first period, the Ordinary Cycle, since in subsequent periods most of the seats will already be filled. Figure 2 below shows the proportion of students assigned to each preference by enrollment period, rather than by educational level. 9
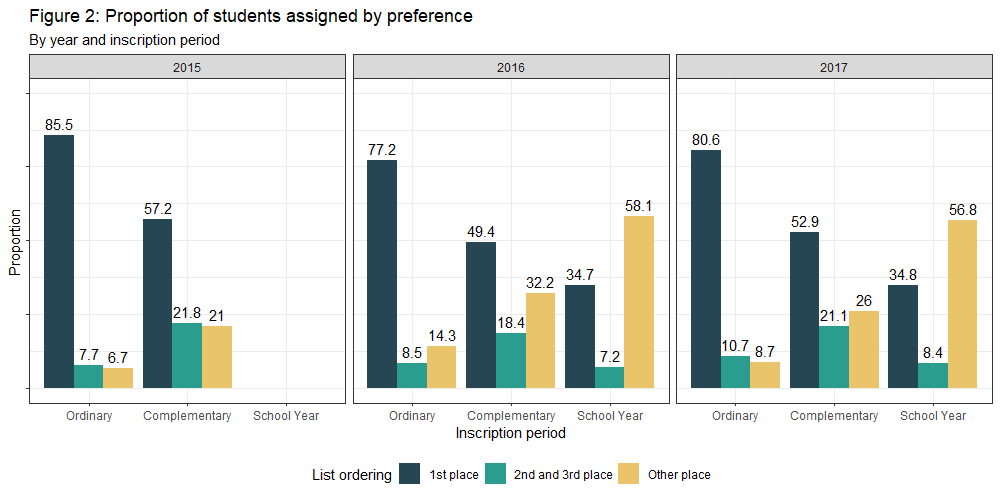
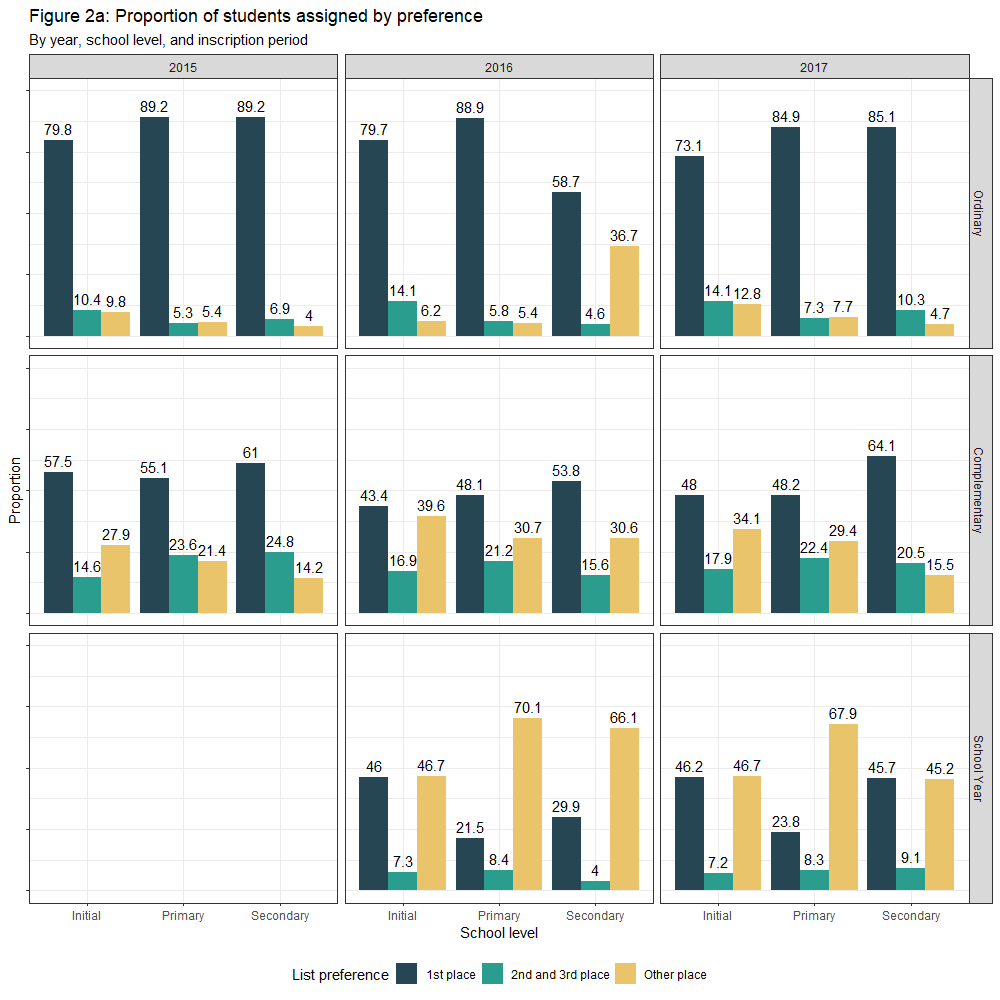
Additionally, Figure 2a (in the appendix) combines the two previous graphs. Here we can see that the proportion of students who are assigned to their first option is significantly higher in the Ordinary period than in the Complementary period, and greater in the Complementary period than in During School Year. This does not seem surprising given that a high proportion of the seats have already been assigned in the Ordinary period, making it more difficult for students who enroll in the following periods to obtain seats in the schools they would like. For example, we can see in the data that 98\% of seats in “over-demanded” schools 10 are assigned in the ordinary period, while only 79\% of those not “over-demanded” are. Equivalently, 97 \% of the seats assigned in the Complementary and School Cycle periods are for schools that are not “over-demanded”. But we also observe lower values of “second and third choice” in all the periods, showing again the negative relation between “first choice” and “other choice”. Once again, however, we can’t disentangle the effect of the scarcity of seats and the effect of the mechanism. In this context of scarcity of seats, the presence of “sophisticated” and “unsophisticated” families could appear as an important factor to take into account.
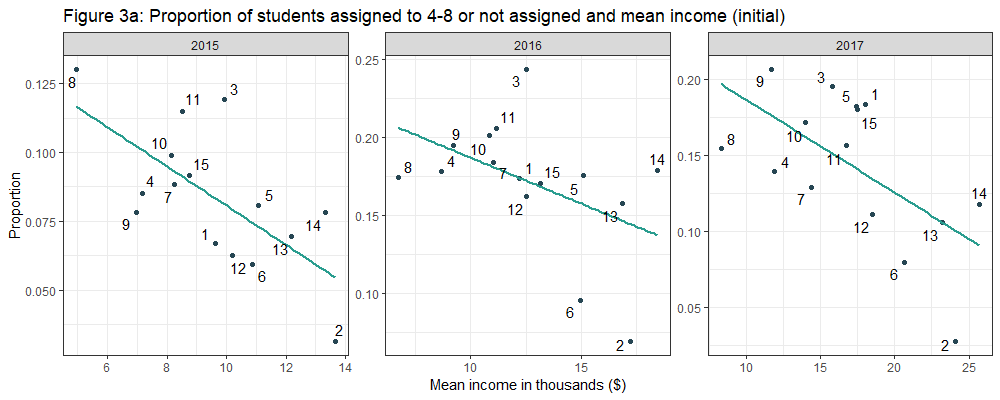
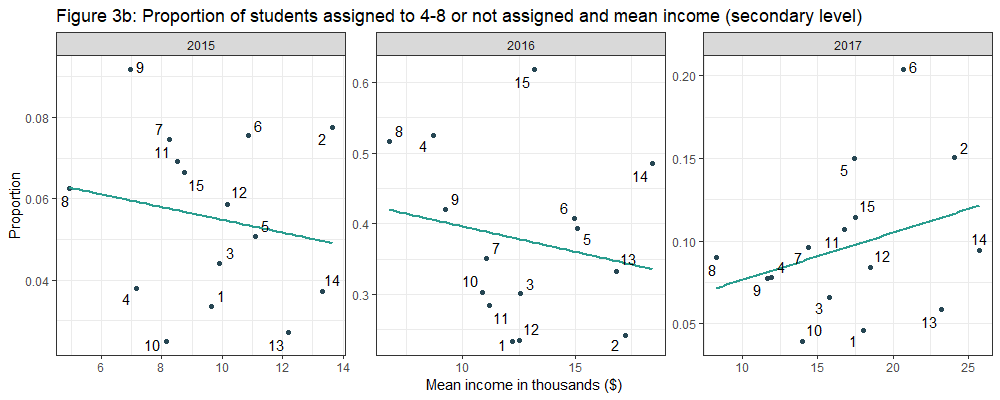
Let us now explore the second issue. As we mentioned in previous sections, there is a fairness argument against this mechanism, and it is that lower-income families tend to be the most affected by the difficulty of designing strategies with their list of preferences. This is something that (Abdulkadiroglu et al., 2006) also show using Boston data. Here we cannot do the same analysis due to a lack of information in our data, but we can do something related. Of the three available levels -initial, primary, and secondary- it is more common for students to live close to the institution in the primary level. At the initial level parents usually inscribe students near their workplace, and at the secondary level students often use public transport to attend the school. Since we can only identify students income by the location of the school attended, we believe that students at the primary level offer the best way to do that. 11 Then, we perform an analysis at the district (comuna) level using average income level together with the proportion of students assigned to preferences 4-8 or not assigned. 12
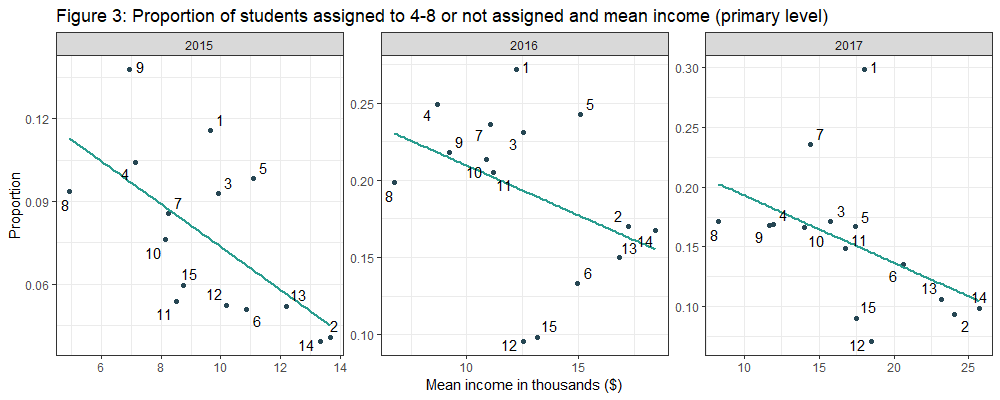
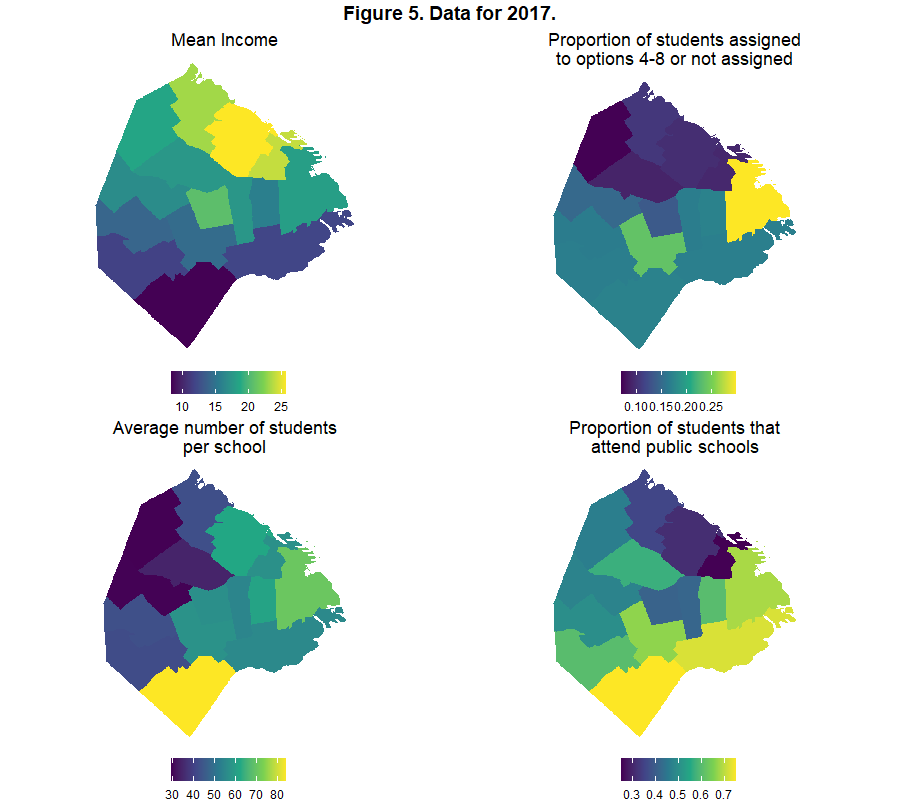
Here we seem to observe a negative correlation between the average income of the district and the proportion of students who are assigned to their option 4-8 or not assigned. Several reasons that could explain this correlation. In the first place, if it is the case that schools located in lower-income neighborhoods are less in demand (for infrastructure or teaching quality issues, for example) and families in these neighborhoods seek schools outside their district, even at the expense of the priority by distance that they would have in their nearby schools, then it is likely that these families will be rejected in the schools outside their neighborhood, since they do not have priority, and they have no other option than to choose a school in their vicinity. Under this hypothesis, schools located in low-income districts would have students who did not choose their school as their first option in a higher proportion. This hypothesis is impossible to test with current data (because we don’t know where students come from).
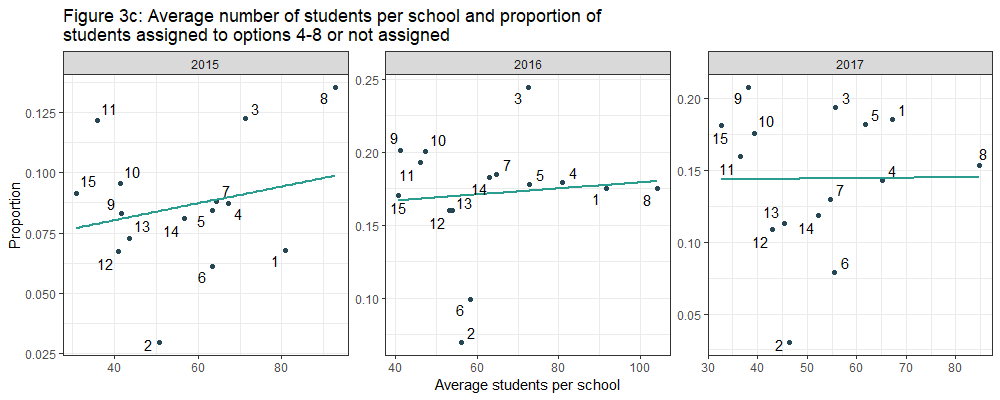
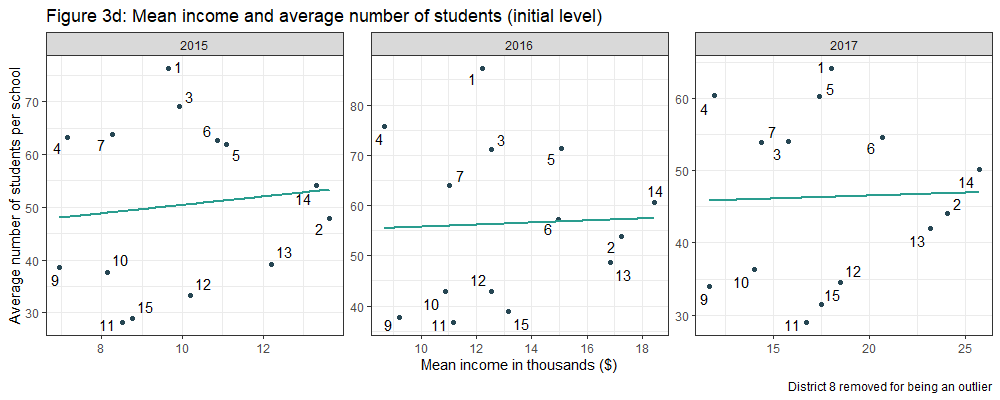
Another plausible hypothesis is that the higher population density and lack of infrastructure in lower-income neighborhoods implies that schools in these neighborhoods are overcapacity and that it is more difficult for families to obtain their first option simply because of a shortage of available seats. However, if we take the average number of students per school as a proxy of a school being overcapacity, we observe that this is not correlated to the proportion of students assigned to 4-8 or not assigned, as shown in Figure 3c, and there does not appear to be a relationship between income and the average number of students per school neither, as shown in Figure 3d. 13
Finally, it also seems to be consistent with the hypothesis mentioned above about the effects that this mechanism has on the results obtained by “sophisticated” and “unsophisticated” families, where “sophisticated” families are usually of higher income and have the time and tools to understand the incentives of the system and incorporate the recommendations of the administration; while the “unsophisticated” families are usually lower-income who for various reasons fail to understand the incentives of the system and pay the price by not being assigned to a seat in a school of their choice with higher probability. This is not verifiable either without data on the socioeconomic status of each of the students. Therefore, this negative correlation is not enough to support this hypothesis.
Bibliography
- Abdulkadiroğlu, A., Pathak, P. A., & Roth, A. E. (2009). Strategy-Proofness versus Efficiency in Matching with Indifferences: Redesigning the NYC High School Match. American Economic Review, 99(5), 1954–1978. https://doi.org/10.1257/aer.99.5.1954
- Defensoría del Pueblo. (2015). Inconsistencias y errores detectados en el sistema de inscripción en línea del Ministerio de Educación del GCBA.
- Abdulkadiroglu, A., Pathak, P., Roth, A. E., & Sonmez, T. (2006). Changing the Boston School Choice Mechanism (NBER Working Papers No.11965; Number 11965). National Bureau of Economic Research, Inc. https://ideas.repec.org/p/nbr/nberwo/11965.html
Appendix
Footnotes
-
RESOLUTION No. 3337 / MEGC / 13 - Annex. Own translation. ↩
-
Although the criteria for choosing these 5 schools is not public, it is believed to be primarily related to proximity to the student’s address. ↩
-
Source here. Original resource in Spanish, own translation. ↩
-
Single tie-breaking means that the lottery number assigned is the same for breaking ties in all schools. In contrast, a multiple tie-breaking lottery draws a different number for each school. ↩
-
Source: FAQ Sistema de Inscripción en Línea. Own translation. ↩
-
This message was displayed for primary and secondary level students, while those who enrolled at the initial level received a similar message: “Attention. The school you chose in first place has no available seats. You will likely be assigned to a waiting list. Are you sure you want to continue? - Cancel - Confirm”. ↩
-
This analysis is based solely on correlations, so we will not be able to draw definitive conclusions. We are working to get access to more detailed data, which hopefully will enhance this analysis in future iterations of this work. We are also working in building simulated preferences, which would allow us to compare outcomes between different algorithms. ↩
-
The database does not contain registration records for the period During School Year for the year 2015. We haven’t been able to find an official explanation for this. ↩
-
In the literature, a school is usually defined as “over-demanded” if the number of seats it has to assign is less than the number of students who place it as the first or second option. Since we do not have the complete list of student preferences, we chose to define a school as “over-demanded” if more than 99\% of the seats assigned to it in the ordinary period went to students that ranked it first. This leaves us with 32 “over-demanded” schools and 108 schools that are not. ↩
-
For completeness, in Figures 3a and 3b, in the appendix, the same figures are made for the initial and secondary levels. ↩
-
We carry out the analysis at the district (comuna) level because, although we have the exact location of each school, the income data for the City of Buenos Aires is only available at this level. The income data is expressed in thousands of pesos. ↩
-
Figure 5 shows these three variables - the proportion of students assigned to their options 4-8 or not assigned, income, and the number of average students per school - and the proportion of all students that attend a public school, through a map of the City of Buenos Aires. ↩